What Are the Best Real-Time Debugging Browser Automation Platforms (May 2026)?

The worst part of real-time debugging browser automation isn't the initial failure but the guessing game that comes after. You've got logs that say something broke, but they don't show you the unexpected modal that appeared or the layout shift that made your selector miss its target. Real-time platforms close that gap with a live viewport and session recordings so you can watch exactly what happened. We're comparing the tools that actually deliver on that promise and where each one makes the most sense.
TLDR:
- Real-time debugging browser automation platforms give you live visibility into what the browser is doing as it executes, cutting debugging time from hours to minutes.
- Skyvern combines live viewport streaming with AI reasoning that explains why each decision was made, making troubleshooting faster than tools that only show what broke.
- Traditional tools like Browserbase and Steel provide infrastructure for debugging but require manual script maintenance when websites change.
- Most platforms offer live session viewing, but only Skyvern adds visual element annotation and automatic recovery that adapts to layout changes without rewrites.
- Skyvern uses computer vision to read pages visually rather than relying on brittle selectors, so production workflows keep running when target sites update their UI.
What Are Real-Time Debugging Browser Automation Platforms?
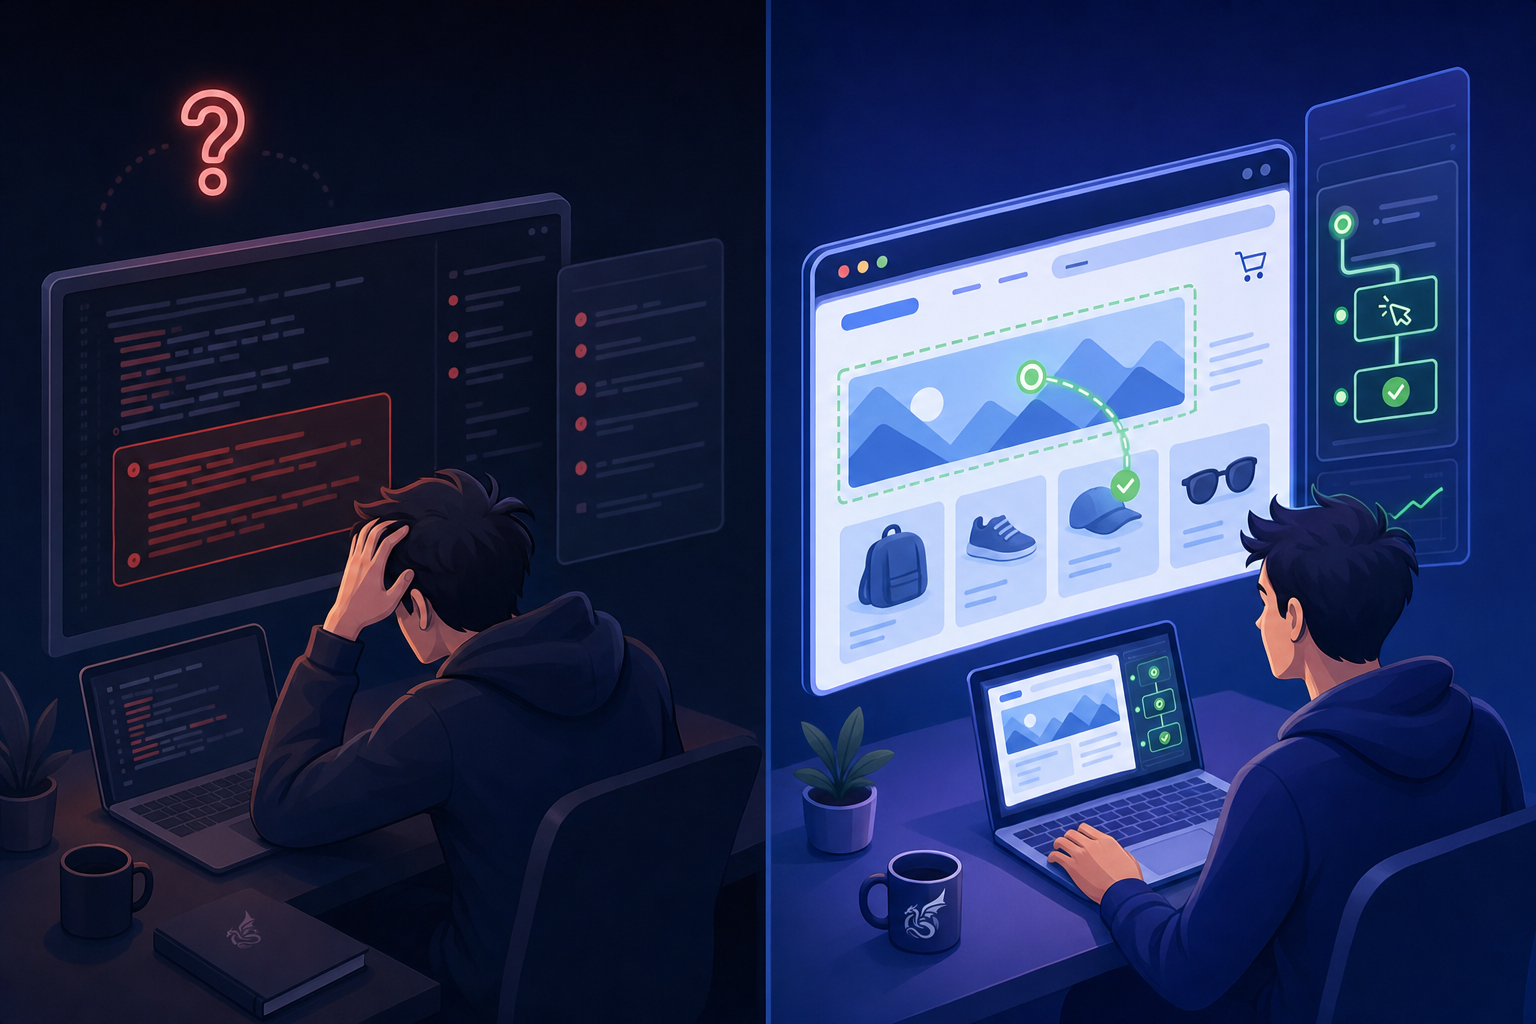
Traditional browser automation gave you one feedback loop: run, fail, read logs, guess, repeat. That cycle burns hours when something goes wrong inside a complex multi-step workflow.
Real-time debugging browser automation platforms close that gap. rather than waiting for a run to finish and sifting through post-execution logs, you get live visibility into what the browser is doing as it executes. Live viewport streaming, session recordings, console output, and network inspection all feed into one debugging view so you can watch automation behavior unfold rather than reconstructing it after the fact.
The distinction matters because automation failures rarely announce themselves clearly. A form might partially fill before hitting an unexpected modal. A session might drop mid-flow right after successful authentication. Error handling requires real-time visibility to diagnose these issues. Post-execution logs capture that something failed. Real-time tools show you exactly why, and that difference can cut debugging time from hours to minutes.
How We Assessed Real-Time Debugging Capabilities
We assessed each option across five dimensions that reflect how debugging actually plays out in production automation workflows:
- Live viewport access. Whether you can watch the browser execute in real time, since visual context mismatches often cause failures that logs alone won't reveal.
- Session recording and replay. Whether the service captures full recordings for post-mortem debugging, especially when issues only surface intermittently.
- Console and network visibility. Whether you can inspect JavaScript output and network requests to catch client-side errors during or after execution.
- Debugging overhead. Whether turning on debug features noticeably slows session startup or execution time.
- Multi-session support. Whether you can monitor concurrent automation sessions when investigating parallel workflow failures or environment-specific issues.
Best Overall Real-Time Debugging Browser Automation: Skyvern
Skyvern is built for browser automation that needs to work reliably in production, beyond controlled demos. Where most automation tools break the moment a website updates its layout or shifts a button, Skyvern reads the page visually the same way a human would, identifying elements by appearance rather than fragile XPath selectors or brittle DOM paths. The real-time debugging capabilities are where Skyvern separates itself from the field. Engineers get a live viewport into every running automation, watching exactly what the agent sees and does as it happens. When something goes wrong, there's no guessing.
Four capabilities make Skyvern the go-to choice for automation troubleshooting:
- Live viewport access lets you watch the agent move through pages in real time, so you can catch unexpected behavior the moment it occurs rather than piecing together what happened from logs after the fact.
- Step-by-step action tracing records every click, scroll, and input with visual context, giving engineers a full replay of any automation run.
- AI-generated reasoning explains why the agent made each decision, so debugging goes beyond identifying what broke and gets to why.
- Automatic recovery handles dynamic page changes mid-run, reducing the number of failures that even require manual investigation.
Key features
- Real-time live viewport with full agent visibility during active runs
- Action-by-action trace logs with visual snapshots attached to each step
- AI reasoning output that explains field-level and navigation decisions
- Resilient visual parsing that adapts to layout changes without script rewrites
- Proxy and authentication support built in, including MFA flows
Limitations
- Best suited for teams running complex, multi-step workflows where visual debugging pays off most
- Requires some onboarding time to get the most out of the AI reasoning outputs
Bottom line
Best for engineering teams who spend a lot of time diagnosing broken automation scripts across dynamic websites. It's ideal for organizations running high-volume, multi-step workflows, but teams with very simple, static automation needs may find the feature depth more than they require.
CloudCruise
CloudCruise markets itself as the easiest way for developers to build browser agents, structuring automations as directed graphs with built-in repair capabilities to keep workflows running when websites change.
Key features
- Node-level debugging that pinpoints failures within specific graph paths rather than requiring full log review
- LLM-powered action interpretation that understands natural language commands
- Self-healing agents that adapt to UI changes without manual script rewrites
- Visual graph builder that makes workflow structure and failure points easier to read
Limitations
- No computer vision for working across unseen websites without site-specific configuration
- Still requires initial per-site setup despite better adaptability than traditional scripting tools
Bottom line
Best for developers embedding browser automation into their own products who want graph-based debugging and self-healing workflows. It works well for teams that can configure target sites upfront, but lacks the cross-site portability that fully visual AI approaches provide.
Steel
Steel is an open-source browser infrastructure tool built for developers who want low-level control over automated browsing sessions. It sits closer to raw Puppeteer or Playwright than to an AI-driven agent, giving engineers direct access to browser instances with built-in session management, proxy support, and CAPTCHA handling.
Key features
- Session persistence lets you maintain browser state across multiple requests without re-authenticating each time.
- Built-in proxy rotation and CAPTCHA handling reduce the setup work for scraping and data collection workflows.
- REST API access means any language or framework can connect to running browser instances.
Limitations
- Steel requires explicit browser commands rather than task descriptions, so scripts break when page layouts change.
- There is no live viewport or real-time debugging interface for watching sessions as they run.
- Automation troubleshooting requires reading logs rather than observing live browser behavior visually.
Bottom line
Best for developers building scraping pipelines or data extraction workflows who want infrastructure control without abstraction. It's ideal for engineering teams comfortable writing low-level browser commands, but teams that need real-time debugging visibility or automation monitoring across dynamic web workflows will hit its limits quickly.
Anchorbrowser
Anchorbrowser is a cloud browser infrastructure tool built for developers who need live access to browser sessions during automation runs. It provides a live viewport so engineers can watch exactly what a browser is doing in real time, which makes it useful for spotting where an automation breaks down without having to replay logs after the fact.
Key features
- Live viewport access lets you watch browser sessions as they execute, so you can catch failures the moment they happen rather than reconstructing them from logs.
- Session recording and replay give teams a way to revisit what happened during a run for post-mortem debugging.
- Cloud-hosted infrastructure removes the need to manage your own browser fleet.
Limitations
- Debugging visibility is strong, but Anchorbrowser is infrastructure, not an agent, so you still write and maintain the automation logic yourself.
- Teams dealing with dynamic sites or frequent layout changes will still face brittle script failures that the live viewport surfaces but does not fix.
Bottom line
Best for developer teams who need low-level browser infrastructure with real-time session visibility. It's ideal for engineers comfortable writing Puppeteer or Playwright scripts who want live debugging without self-hosting browsers, but it requires full coding ownership of the automation layer.
Airtop
Airtop provides cloud browser infrastructure built around real-time visibility and natural language control. Teams watch automations run through live view URLs with a full session audit trail, making it easier to catch failures without waiting for post-run logs.
Key features
- Live view URLs for real-time browser visibility during active automation runs
- LangSmith integration for prompt engineering and multimodal debugging when AI models produce unclear error messages
- Act and Extract APIs that accept natural language commands for clicking, moving through pages, and pulling structured data
- Session persistence for long-running workflows
Limitations
- Customization is limited to Airtop's APIs and templates, with complex automations outside its abstractions often needing workarounds
- No session replay tooling for post-failure debugging
- US-based proxy infrastructure causes region-locked authentication to fail for non-US workflows
Bottom line
Best for teams wanting quick deployment of natural language-driven automations with live debugging visibility. It's approachable for straightforward AI agent workflows, but the absence of session replay and geographic proxy constraints make it a poor fit for teams with international requirements or deep post-mortem debugging needs.
Browserbase
Browserbase is a cloud browser infrastructure tool built for developers who need reliable, scalable headless browser sessions. It focuses on running browsers in the cloud with built-in support for proxies, CAPTCHAs, and session management.
Key features
- Live session viewing lets you watch browser sessions as they run, giving you a real-time viewport into what your automation is doing at any given moment.
- Session replay and logging help with automation troubleshooting after the fact, so you can trace exactly where a workflow broke.
- Built-in proxy rotation and CAPTCHA handling reduce common failure points in production automation runs.
Limitations
- Debugging tools are infrastructure-focused, so browser automation debugging is limited compared to tools with dedicated visual debugging layers.
- No AI-driven self-healing means broken selectors require manual fixes.
Bottom line
Best for developers building custom automation who need cloud browser infrastructure with real-time debugging visibility. It's ideal for engineering teams comfortable writing code, but requires substantial dev investment to maintain scripts over time.
Feature Comparison of Real-Time Debugging Platforms
Not every tool covers the same ground. The platforms above each take a different approach to live viewport access, session recording, layout resilience, and AI-driven recovery. Some give you infrastructure to debug against; others build debugging intelligence directly into the execution layer. Here's how each stacks up across the debugging dimensions that matter most in production.
Tool | Core Approach | Layout Resistance | Debugging Strengths | Limitations | Best For |
|---|---|---|---|---|---|
Skyvern | Computer vision-based AI agent with visual understanding and reasoning output | Adapts to layout changes automatically without script rewrites using visual parsing | Live viewport streaming, AI decision explainability, visual element annotation, step-by-step action tracing with context | Requires onboarding time to get the most out of the AI reasoning outputs; best suited for complex workflows | Engineering teams debugging dynamic, multi-step workflows across frequently changing websites |
CloudCruise | Graph-based workflow builder with LLM-powered action interpretation and self-healing | Self-healing agents adapt to UI changes within configured sites without manual rewrites | Node-level debugging within graph paths, visual workflow structure, automatic repair capabilities | Requires per-site configuration; no computer vision for cross-site portability | Developers embedding automation into products who can configure target sites upfront |
Steel | Open-source browser infrastructure with low-level Puppeteer-style control | No layout resistance; scripts break when page structures change | Session persistence, REST API access, built-in proxy and CAPTCHA handling | No live viewport or visual debugging interface; requires reading logs for troubleshooting | Developers building scraping pipelines who want infrastructure control and are comfortable with low-level commands |
Anchorbrowser | Cloud browser infrastructure with live session access | No layout resistance; requires manual script maintenance when sites change | Live viewport access during execution, session recording and replay for post-mortem analysis | Infrastructure-only tool; teams write and maintain automation logic themselves | Developer teams needing live debugging visibility without self-hosting browsers |
Airtop | Cloud browser with natural language control via Act and Extract APIs | Limited to API abstractions; complex scenarios outside templates need workarounds | Live view URLs for real-time visibility, LangSmith integration for prompt debugging | No session replay; US-only proxies cause region-locked authentication failures; limited customization | Teams deploying straightforward AI agent workflows with natural language commands |
Browserbase | Cloud browser infrastructure with session management and built-in anti-detection | No self-healing; broken selectors require manual script fixes | Live session viewing, session replay and logging, proxy rotation and CAPTCHA handling | Infrastructure-focused debugging; no AI-driven recovery or visual debugging layers | Developers building custom automation needing cloud infrastructure with real-time visibility |
Why Skyvern Is the Best Real-Time Debugging Browser Automation Platform
Most tools give you infrastructure for debugging. Skyvern gives you intelligence. Live viewport streaming works alongside YAML-based workflow definitions, so both visual execution and automation logic stay transparent without code changes.
The computer vision foundation changes what troubleshooting actually looks like. When something breaks, you're diagnosing visual interpretation rather than hunting for a CSS selector that stopped matching after a site update. The explainable AI layer shows why each element was selected and what alternatives were considered, which makes failure analysis faster and more actionable.
A single API covers data extraction, form filling, authentication, and file downloads. This makes Skyvern one of the top browser automation tools in 2026 available today. The computer vision engine adjusts to UI changes automatically, so production workflows keep running without manual maintenance.
Final Thoughts on Selecting Real-Time Debugging Solutions
Debugging browser automation doesn't have to mean reading through logs after every failed run. Real-time debugging closes the feedback loop by streaming live viewport data and explaining why each decision was made, rather than only showing you what happened. Skyvern's computer vision foundation makes troubleshooting faster because you're diagnosing visual interpretation rather than hunting for selectors that stopped working after a site update. Book time with us to see how it works on your workflows.
FAQ
What should you look for first when choosing a real-time debugging browser automation platform?
Look for live viewport access that lets you watch automations execute in real time, session replay capabilities for post-mortem analysis, and detailed action logs that trace each step with visual context. These three features cut debugging time from hours to minutes when workflows break.
How do AI-powered debugging platforms differ from traditional browser automation tools?
AI-powered platforms like Skyvern use computer vision to interpret pages visually and provide reasoning for each decision, while traditional tools rely on DOM selectors and only show you what broke without explaining why. You spend less time hunting through logs and more time understanding root causes.
Which real-time debugging platform works best for teams managing workflows across multiple websites?
Skyvern handles cross-site workflows best because its visual understanding adapts to different layouts without site-specific configuration, and the AI reasoning layer explains decisions across any website. Tools like Steel and Browserbase require separate scripts for each site, making multi-portal debugging much harder to scale.
Can you monitor multiple automation sessions simultaneously with these platforms?
Yes, most platforms support multi-session monitoring, though implementation varies. Skyvern, Browserbase, and Airtop provide concurrent session visibility through their dashboards, while tools like Steel require custom logging setup to monitor parallel runs effectively.